New Bric: Progress Chart

Hi I have a new bric for you!

Progress Chart displays the information in a nice UI table. It’s a chart table with color bars that represent the completion, or progress of each item. Used creatively you can create charts that represent a variety of things.

The chart animates as it comes into view, whether you scroll up or down.

  • Includes optional images.
  • Unlimited entries
  • Images have lightbox enabled.
  • Progress bars for each item.
  • Progress bars animate as they come into view.
  • Header title with style options.
  • Many ways to style things in the sidebar.

Site: Progress Chart
Docs: https://docs.google.com/document/d/1xEYhzClNgHGL7ZN3QeSixDhdNlz5VUK4_7hL-YkhcM8/edit?usp=sharing
Quick Buy: Progress Chart

2 Likes

Well isn’t this an interesting Bric!

Will have to explore a bit…

Thanks Whitt…

Rich the Weather Guy

1 Like

Hi Whittfield:

You have me thinking about this new Bric.
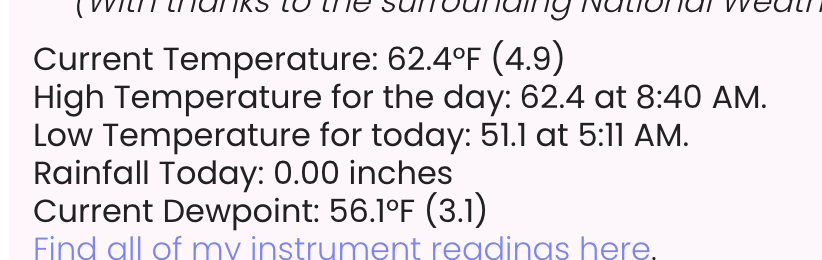
On my main weather page I have current readings from my weather instruments.
These are fed to my webpage by the weather application I use, by inserting “tags” into my web page.
You know I am no technical person…
Is there a way to integrate these temp readings so they would appear in a progress bar? They are uploaded every three minutes.

readings

Just thinking out loud…

Rich the Weather Guy

I don’t think it could be done without some pretty heavy scripting, and even then it’s up for debate.

You’d have to scrape the page for the values every 3min that alone is enough to pull your hair out….then getting the values into the bric is an entirely different approach and would require a rewrite.

So the short answer is unfortunately nope.

Thanks Whitfield, thought I would ask.

Rich the weather guy

@Whittfield Does progress chart also work vertically? I would like to use it for a timeline, like the vertical demo’s here.

Why not use a timeline Bric? :thinking:

Not what I asked but to answer your question: because that does not what I want. :wink:

That looks really nice!